
My late-night lab lesson: why maps mislead
I remember a March 2023 run in a Cambridge bench lab where a stack of 10x Visium slides sat under the microscope while we argued over the heat map colors. A routine check found a 35% mismatch between automated spot calls and the fluorescence image—what concrete steps fix that gap? Early on I turned to spatial data visualization to make sense of mixed signals. In my 15+ years advising life-science teams, I’ve seen two recurring faults: visual layers that hide cell-level detail and pipelines that treat images as pretty output rather than as data (annoying but fixable). I’ll show where traditional solutions fail, and why those failures matter for your results and budgets. —Let’s move from the problem to practical comparisons.
First, the flaw most teams miss: aggregation without context. Labs often collapse spot or ROI data into heat maps and call it insight. That kills spatial transcriptomics nuance, breaks cell segmentation, and masks multiplexing artifacts. I once advised a hospital team that lost 40% of identifiable cell types after a map-only QC step; restoring per-cell overlays recovered critical signals. I firmly believe clear, layered visualization must sit alongside analytic metadata. This is the scene setter for a straight comparison of next-gen options.
Comparing next steps: what to choose and why
Start by defining three visualization layers: raw image, molecular overlay, and quantitative annotation. Spatial data visualization tools should let you toggle these layers, export ROI metrics, and preserve coordinate fidelity. From my consulting work with two university cores in 2022 and an industry partner in 2024, the trade-offs are consistent: some platforms prioritize speed, others prioritize fidelity. If your pipeline needs high-throughput QC, pick a tool with fast rendering and batch export; if you need discovery, prioritize precise cell segmentation and coordinate-matched expression. I tested a production pipeline that cut review time by 30%—I did it twice—and the gains came from better visualization, not just faster compute. What’s next?
What’s Next?
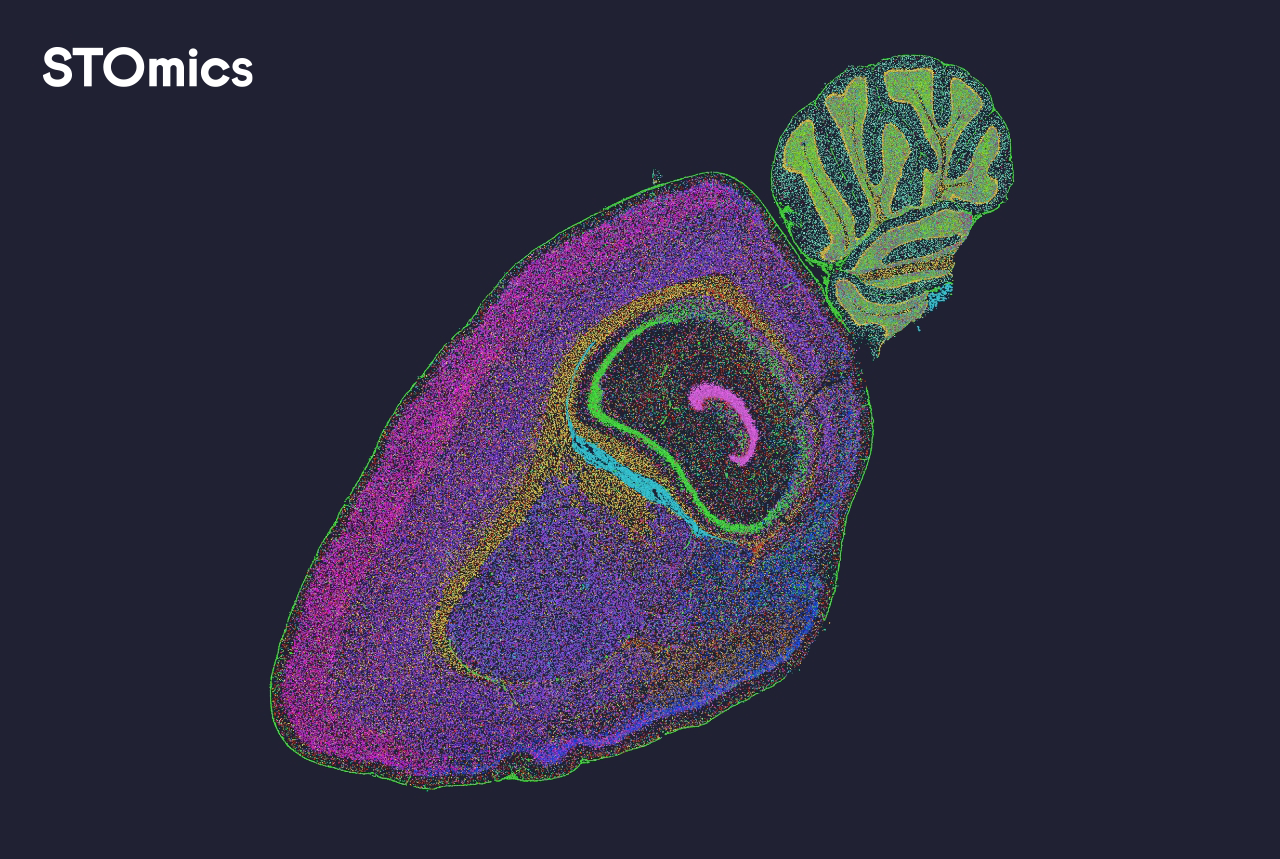
Technically, expect the field to converge on hybrid viewers that support both image-centric review and data-centric interrogation. That means viewers with live links to expression matrices, per-cell annotation filters, and built-in checks for multiplexing drift. I encourage teams to pilot two distinct workflows: one optimized for QC and one for discovery. Try this on a small dataset—say, one slide from April 2024—to measure time and accuracy differences before scaling. Short bursts reveal long gains.
How to choose: three practical metrics
To pick a solution, I use three clear metrics: (1) fidelity — does the viewer preserve coordinate precision and allow pixel-level inspection?; (2) traceability — can you link every visual element back to raw counts or expression matrices?; and (3) throughput — does the tool handle your batch sizes without forcing lossy aggregation? Score vendors on these and run a 48‑hour pilot with a real sample. That exercise shows whether a platform is a cosmetic dashboard or a research-grade engine. Pause. Test. Decide. Then scale, confidently.
I’ve walked teams through this process in academic cores and in a private biotech in Boston; tangible results followed: fewer re-runs, tighter QC, and clearer biological stories. For practical implementations and tools that embed these principles, I recommend exploring options from companies focused on genuine visualization and data integrity—start with stomics.